

Only 1 in 5 High School Seniors Is Proficient in Math. Where Does Vermont Land?
A fresh national snapshot puts U.S. math proficiency in plain numbers — and Vermont right around the middle of the pack. There's also a quiz. See how you'd do.


If you want a single, slightly uncomfortable number to sit with this week, try this one: nationally, about 22% of high school seniors — roughly one in five — scored proficient or advanced in math on the 2024 National Assessment of Educational Progress, the federal test better known as the Nation’s Report Card.
It doesn’t get much more reassuring further up the grades. USAFacts, drawing on that same 2024 NAEP data, puts proficiency at about 39% in 4th grade and 28% in 8th grade before the slide to 22% by senior year. Math proficiency, in other words, thins out the longer kids stay in school.
So where does Vermont fit? Just about where you’d expect — and maybe not where you’d assume.
In 4th-grade math, 36% of Vermont students scored at or above proficient in 2024, a few points under the national 39%. But by 8th grade the picture flips: Vermont’s eighth-graders outperformed the national average, posting an average scale score of 276 against the nation’s 272. No blowout in either direction. Vermont sits right on the national line — a touch below early, a touch above later.
That’s the part worth pondering. It’s easy to assume Vermont — small classes, high spending per pupil, a state that takes real pride in its schools — clears the national bar comfortably. On math proficiency, it mostly just meets it. And the national bar isn’t a high one. Vermont is standing right next to it.
Now the fun part: how would you do?
Below is a real one — the question handed to 12th graders on the 2024 test. Give it a shot before you scroll down to see the correct answer.
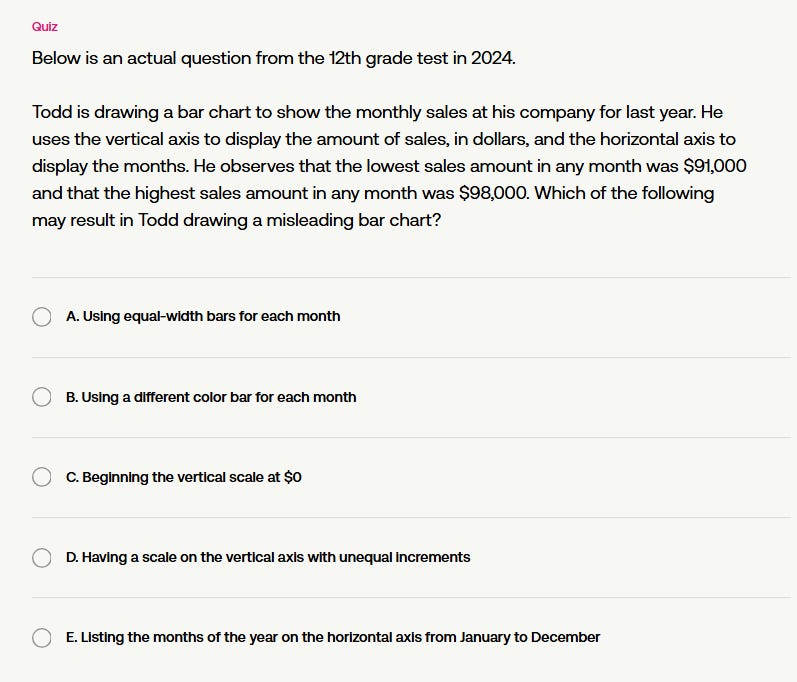
Got your answer locked in? It’s sneakier than it looks — the trap isn’t the choice most people grab first. The answer’s in the fine print at the very bottom of this story.
Sources: USAFacts · The Nation’s Report Card (NAEP), 2024 · Vermont Agency of Education · Vermont Business Magazine · NAEP Vermont Grade 8 State Snapshot
Answer: D. Unequal increments on the vertical axis distort the bar heights — that’s what makes the chart misleading. The tempting wrong pick is C, but beginning the scale at $0 is the honest move, not the deceptive one.